novolyze[2023]
Production Lines and Cleaning Stations
CIP control is a plant dashboard for cleaning-in-place, which cleans production equipment by circulating fluids through it without taking it apart. The line is down while a cycle runs. Operators run the cycles, and quality managers have to prove afterwards that one ran correctly. It was a proof of concept for a food safety company, built for a grant application. I do not know whether the grant went through, and it never shipped. Nothing here was measured. Two people made it, a product owner and me.
The alarm is a band, not a point
An error happens at one moment and then lasts until an operator fixes it.
A point on a chart says only when it started.
Temperature across the whole cycle, with the phases as bands behind it.
The alarm is a band as long as it lasted.
The tools I measured this against stack one cycle in ten rows. Five lanes, then a chart each for five sensors. So one chart, one measurement, and the phases behind the curve instead of above it. The alarm at half past nine lasted 55 minutes, inside the caustic phase.
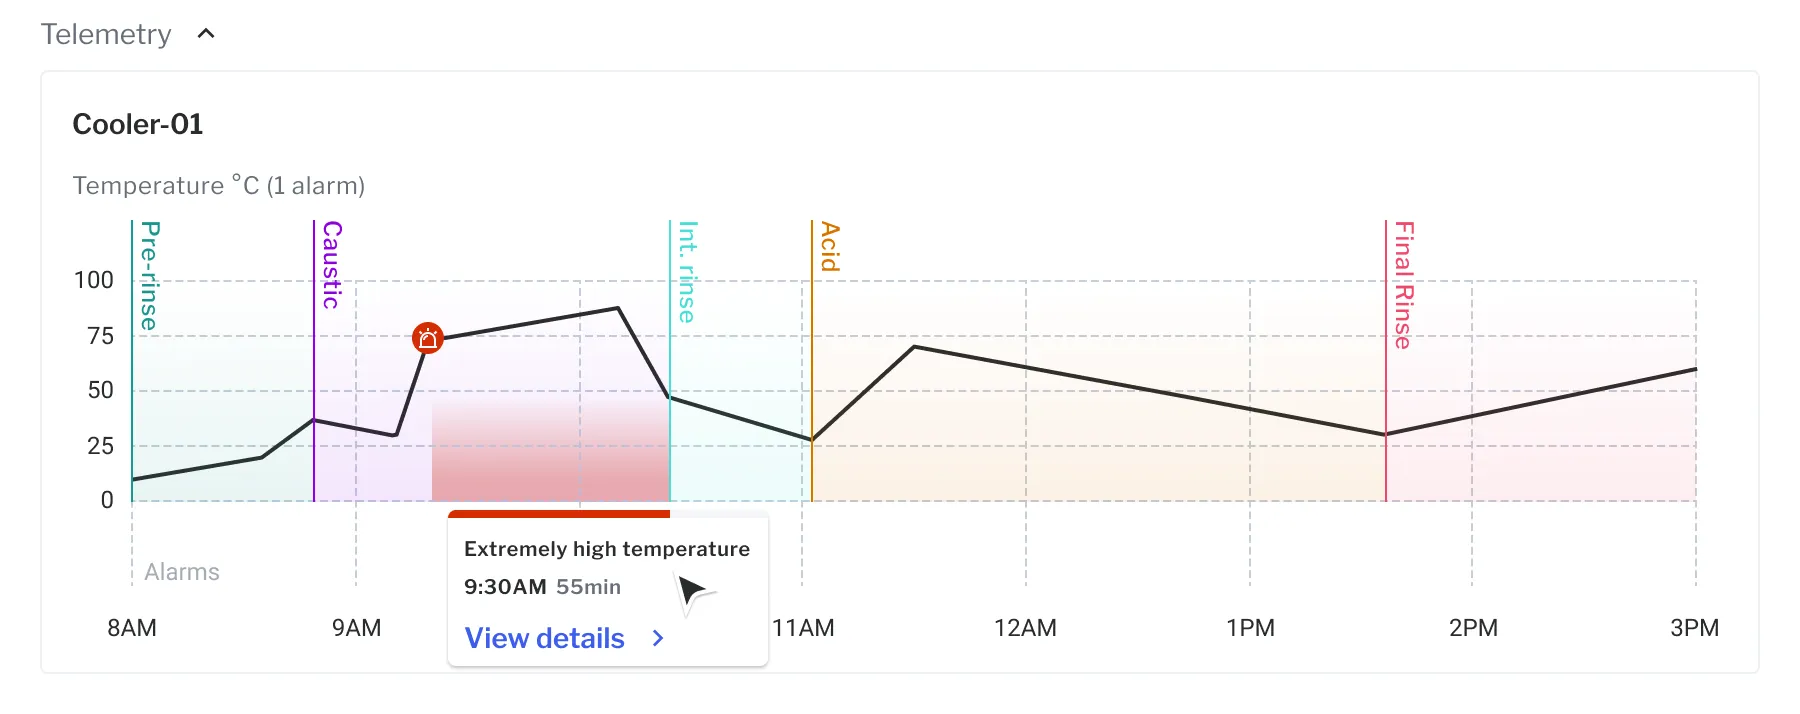
One cycle, six hours. The alarm at 9:30 fired inside the caustic band.
I put the lines and the machines in one list
Both of them are a thing that gets cleaned, so both of them are rows in the same list.
Two lists, and a page of its own under each.
A machine moves between lines, so a line and a machine answer different questions.
A plant can have three lines and two cleaning machines. One is stationary, the other moves between lines. So a line wants its own history, and a machine wants the history of the lines it served. I had merged them first. The product owner knew the need better than I did.
Both lists use the same card. How long the cycle has run or how long ago it ended, the alarm count, and one status of Cleaning, Released or Hold.
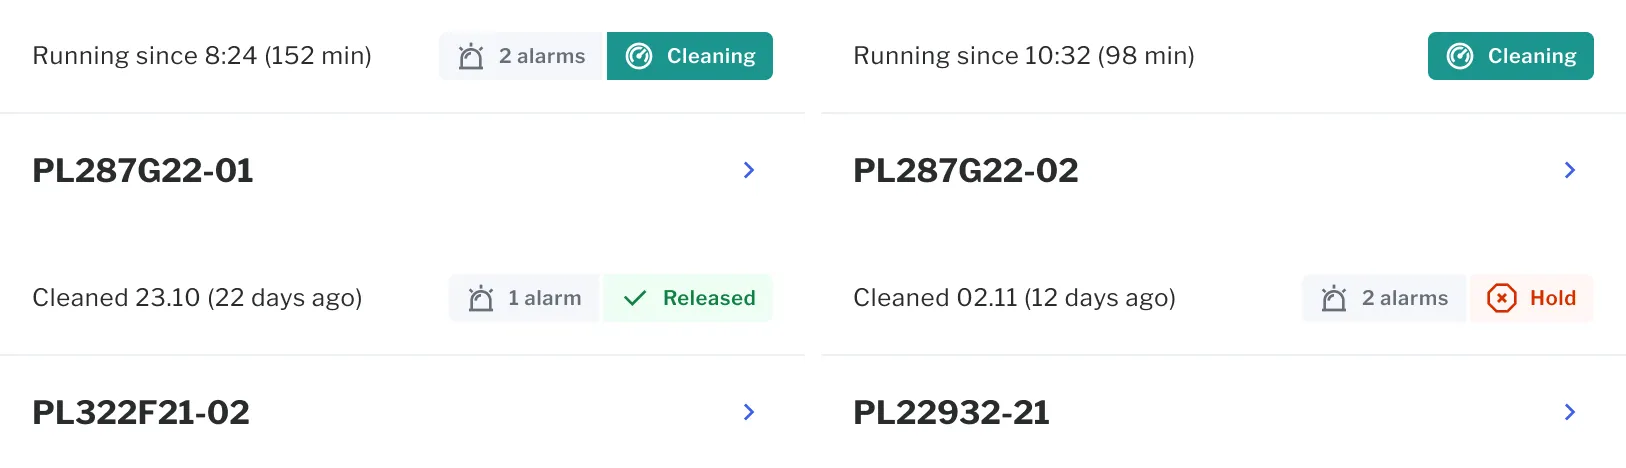
Production lines. Two are cleaning now, two carry the result of their last cycle.
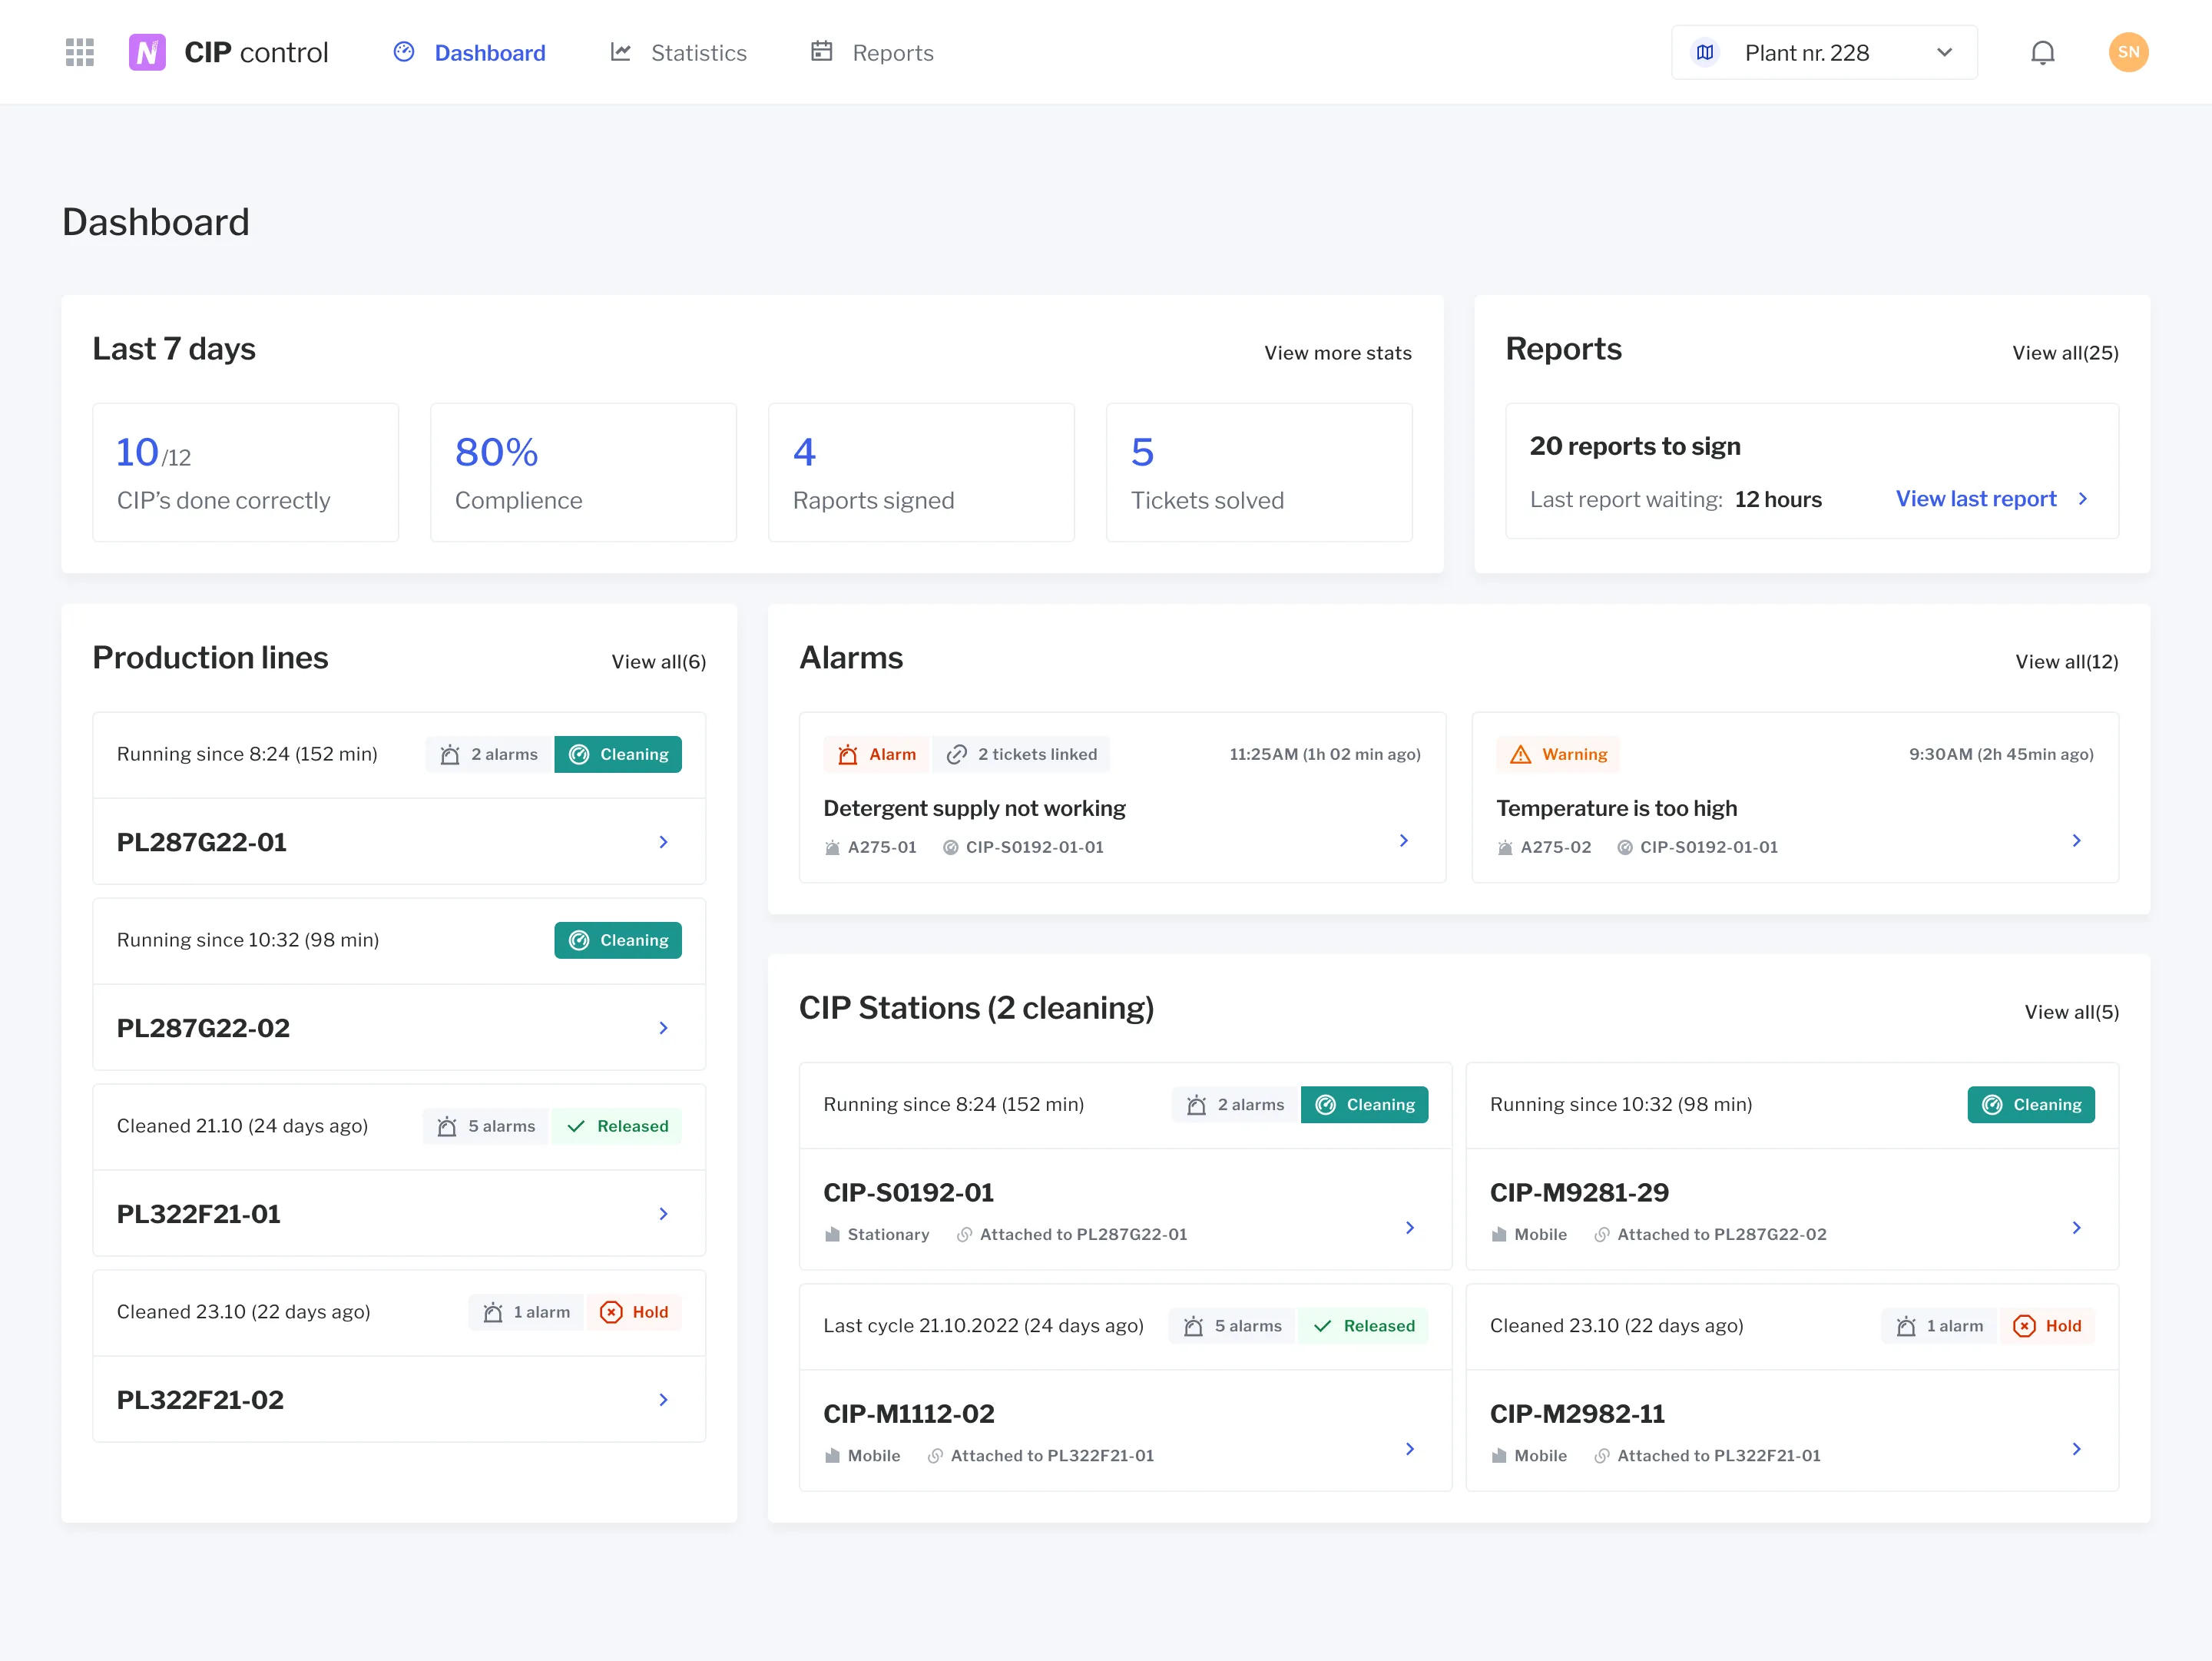
The two lists on one plant dashboard, lines on the left and machines below the alarms.
Sensor readings sit where they are measured
Operators need fluid states and sensor data while a cycle runs, to follow progress and catch errors.
The circuit is the layout.
Volumes, conductivity, temperature, pressure and flow are drawn on the equipment that reports them.
Four tanks hold reclaim, water, caustic and acid, each with its volume and its conductivity. Supply and return are stated separately, so the water going out can be compared with what comes back. Operators already read schematics like this on paper. I modernised the form, I did not invent it.
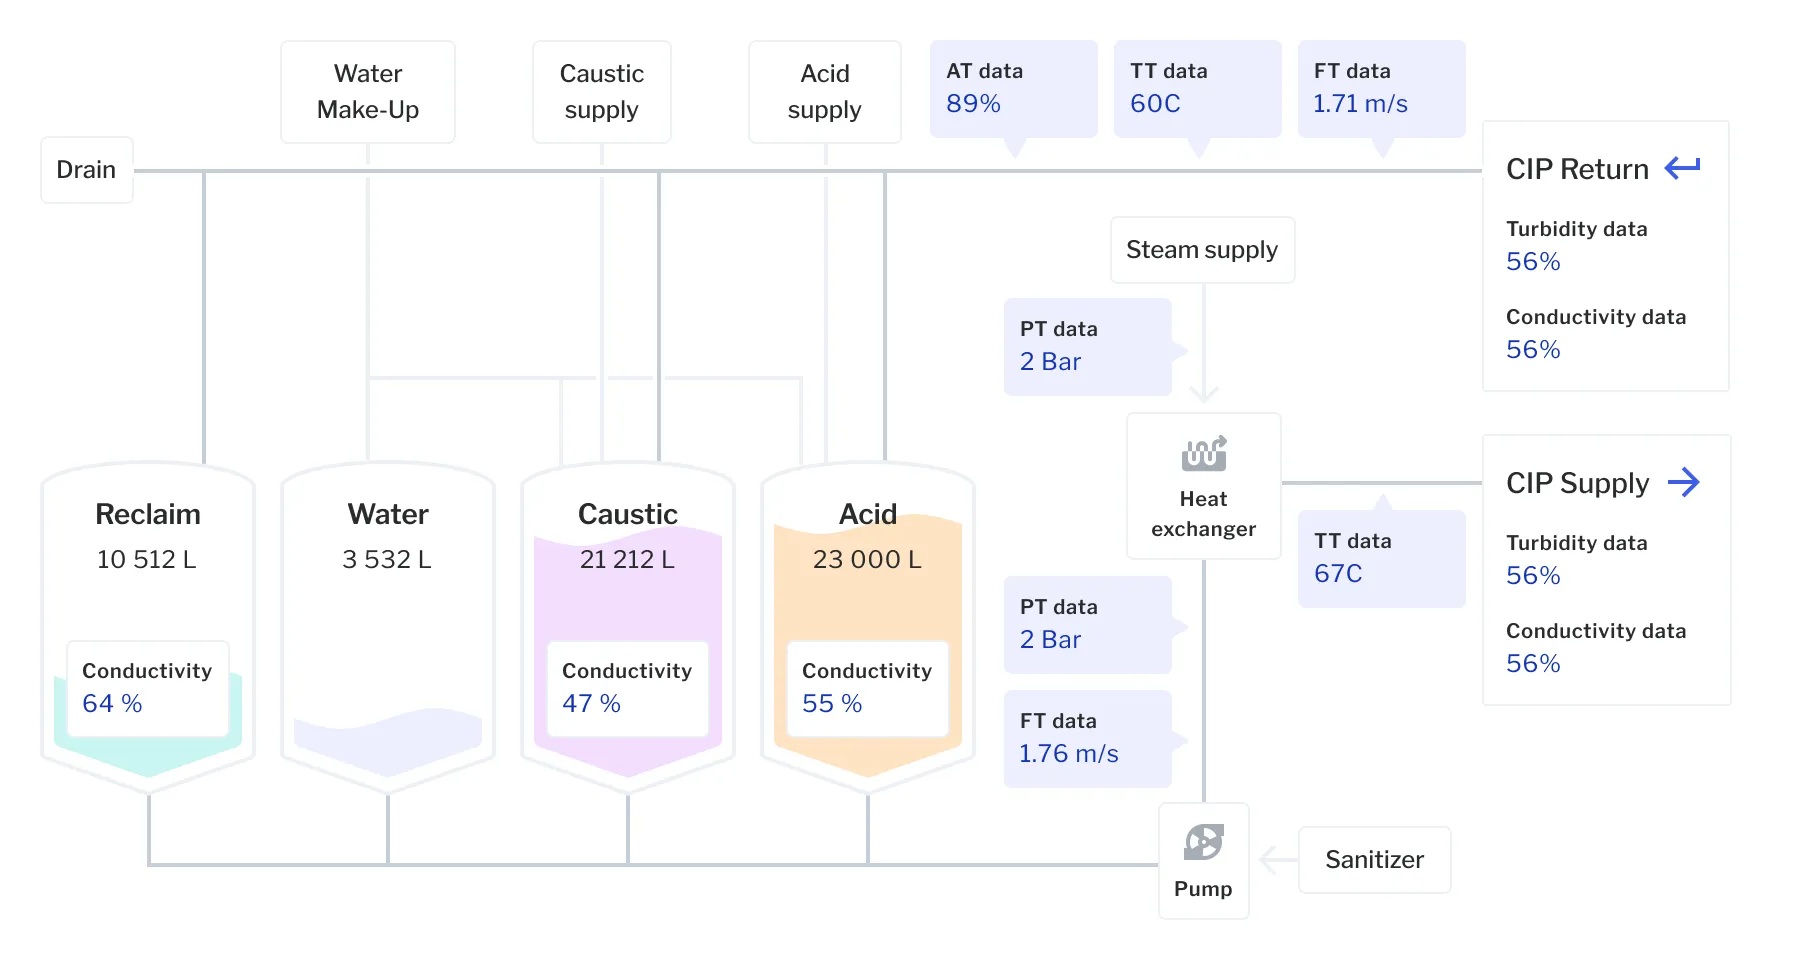
Acid at 23,000 litres, with the conductivity read-out at 55%. Return turbidity reads 56%.